Data and Methods
In this project, we collect about 30,000 tweets from different districts and arenas such as beaches and parks. After collecting tweets, we deleted similar tweets and retweets because they could reduce the accuracy of our model.
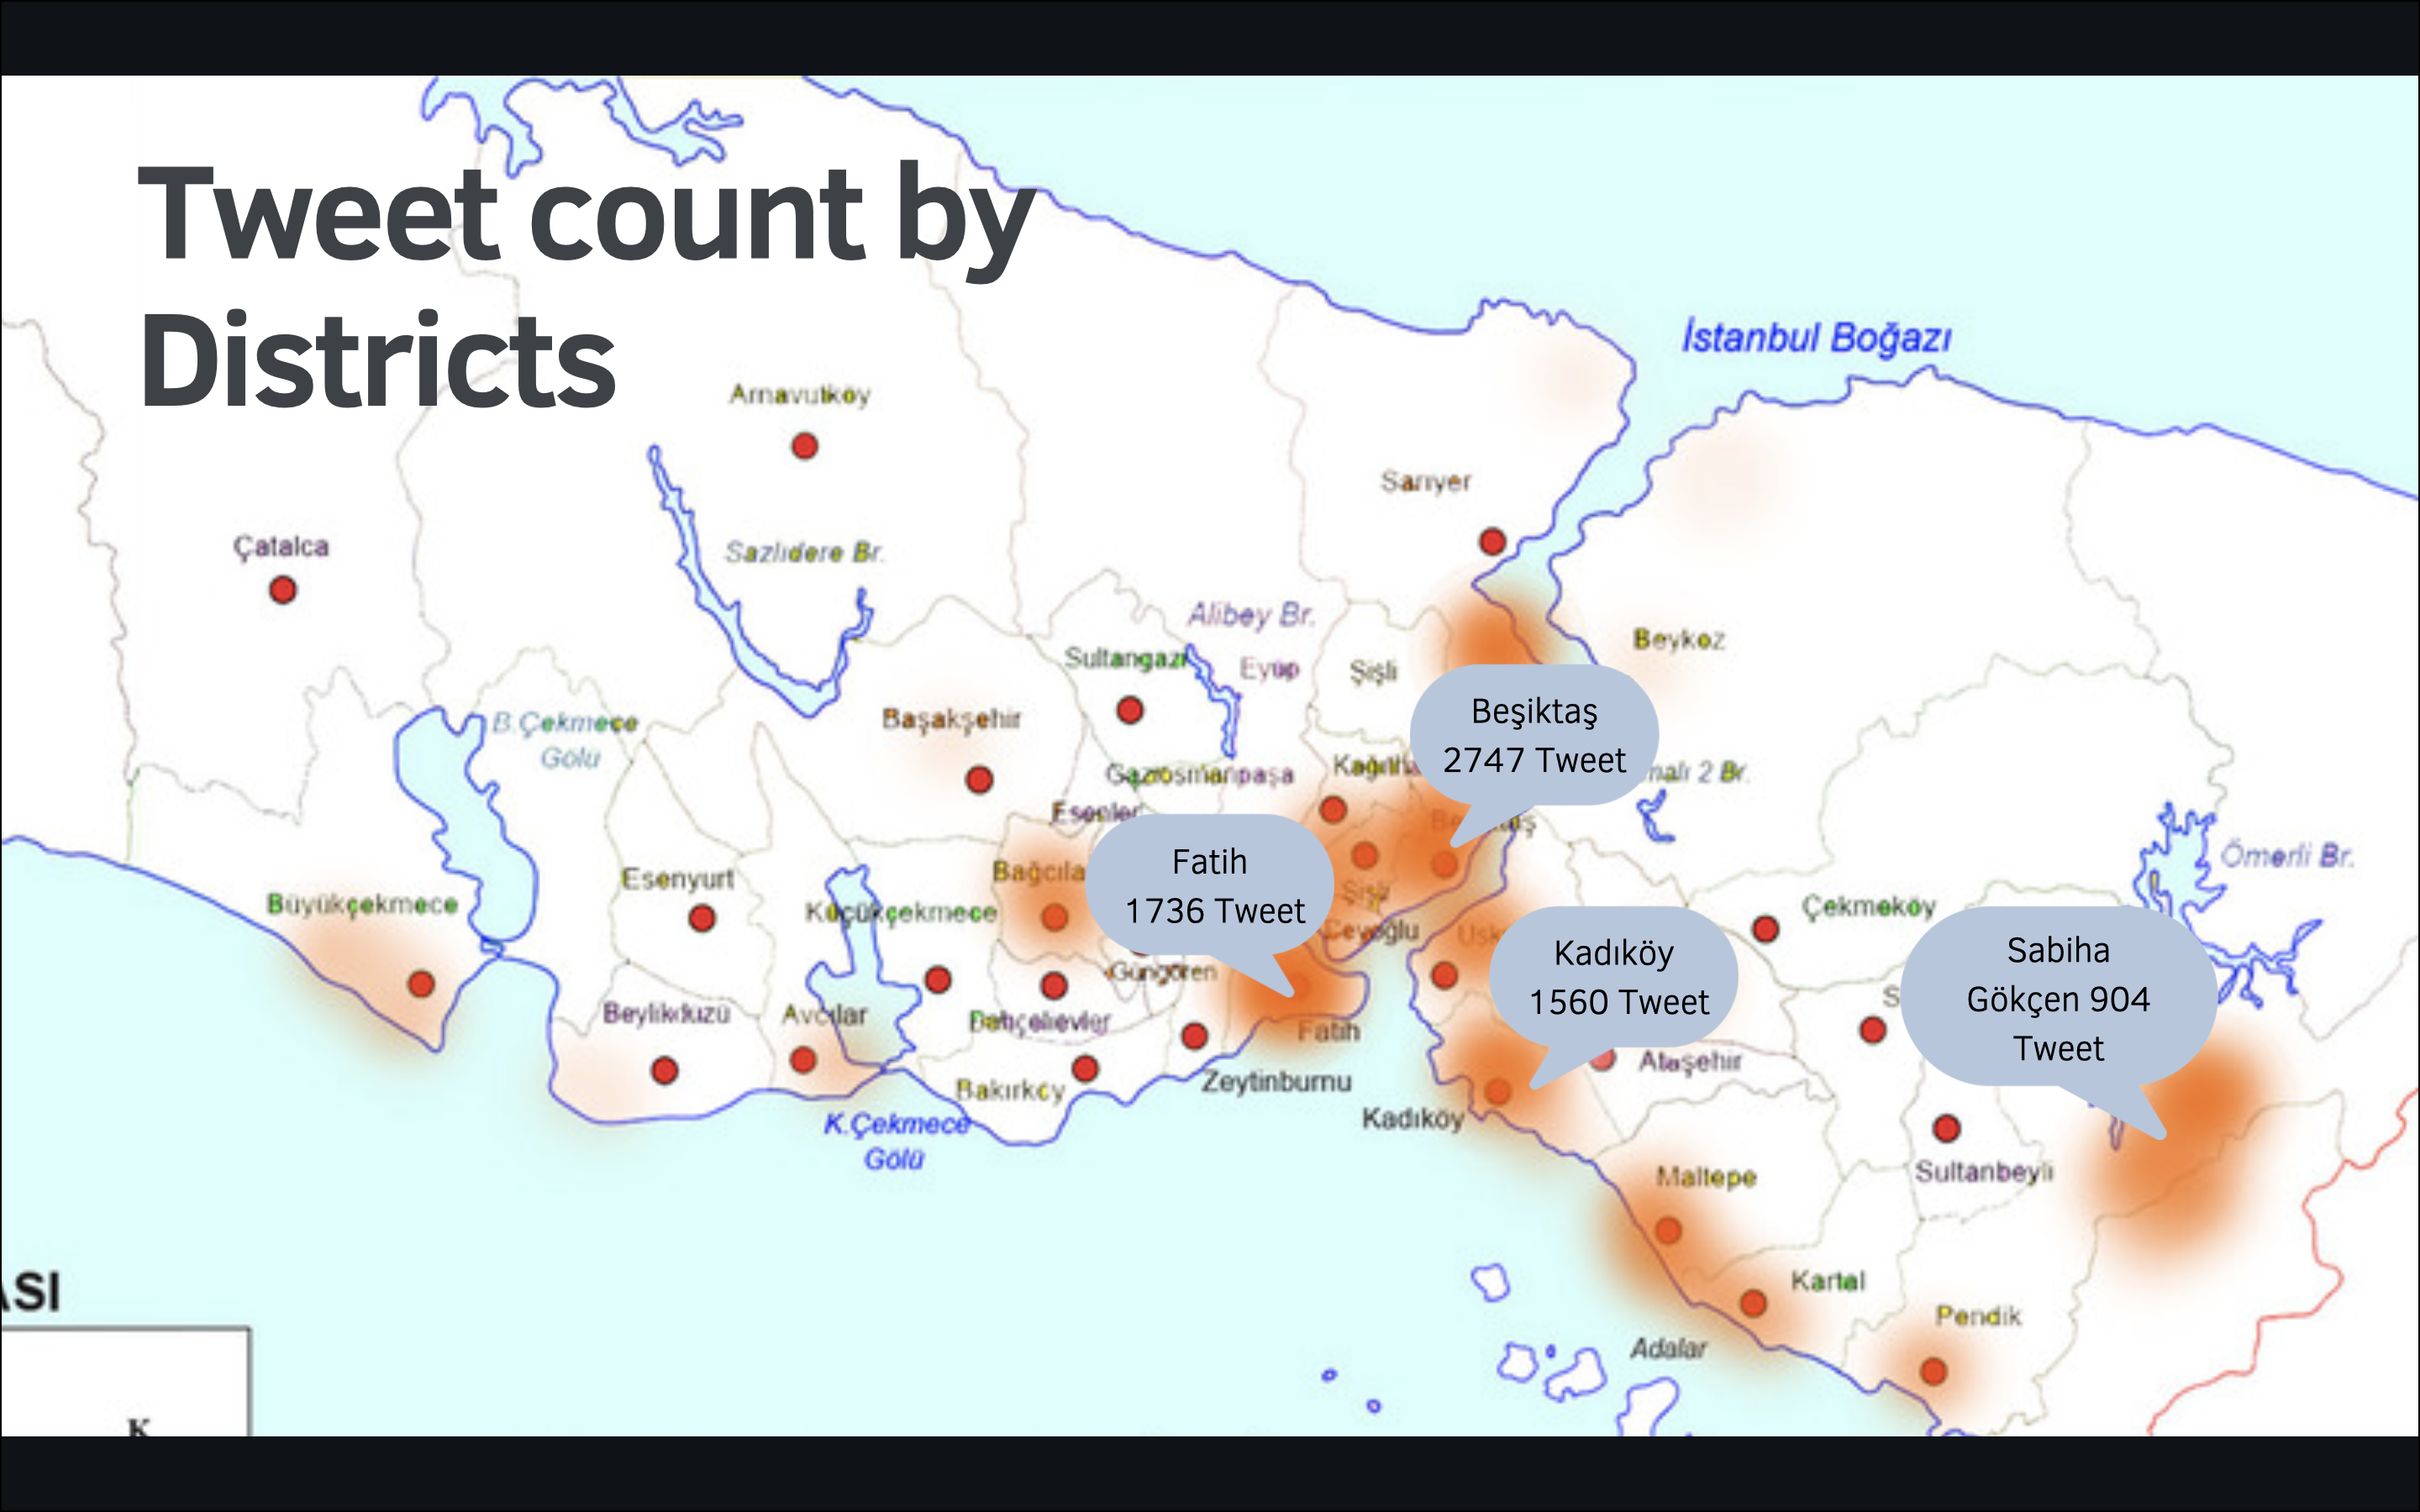
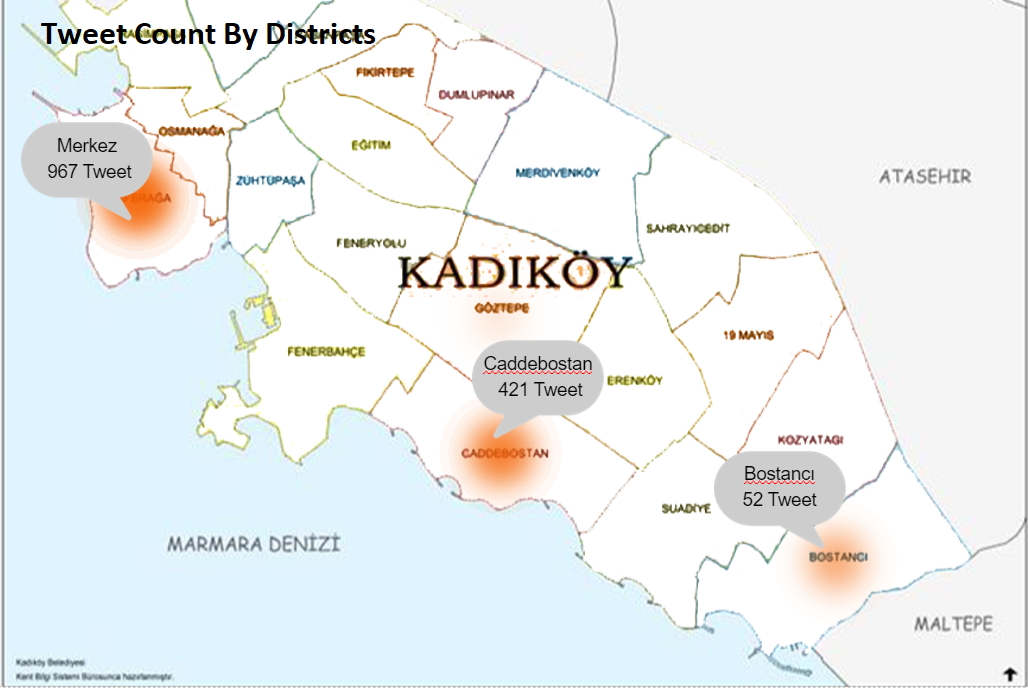
img: heat map of the number of tweets in certain regions
After deleting similar tweets, we pretend every tweet we convert Turkish characters into universal characters, if we can't fix them, we try to fix meaningless words.
After that, we started tagging the tweets one by one and it was the longest part of our project, we tagged the tweets as follows: -> "0" does not show density for tweets -> Specify "1" density for tweets
After tagging 1000 tweets (500 for “0”, 500 for “1”), we trained our model and after training, we tested our model with our test data set. At this stage, we used four different algorithms. We achieved 70% acurracy in the logistic regression algorithm. img: accuracy scores in different methods.
At the end of our work, we connect our model to the twitter API and live tweet stream. Our live stream model estimates whether tweets indicate density. If a tweet specifies the density, our model detects regions and tweets: I detect excessive density in the field: district name